

London Real Estate Market Update For November 2017
The London area began compiling and analyzing real estate data in 1978. With one more month left in 2017 the London area has a set a new record. 10,790 homes have been sold this year. This makes 2017 the year for the highest number of home sales since 1978!
Market Breakdown
- 637 homes exchanged hands last month, down 13.6% from the same time a year ago
- Year-to-date sales are up 9.1%, with a total of 10,790 homes sold
Average Home Prices
- In November, the average sales price across London and St. Thomas was $322,303, up 11.6% from the same time a year ago
- The average year-to-date sales price is $330,039, up 18.0% from November 2016.
Average Home Prices Broken Down By Area*
- London South, the average home sales price was $344,010, up 16.6% compared to a year ago
- London East, it was $255,518, up 7.9% from November 2016
- London North, average home sales price was $383,147, up 9.9% compared to this time last year
- St. Thomas it was $260,763, up 19.4% compared to a year ago
Average Home Prices Across SW Ontario
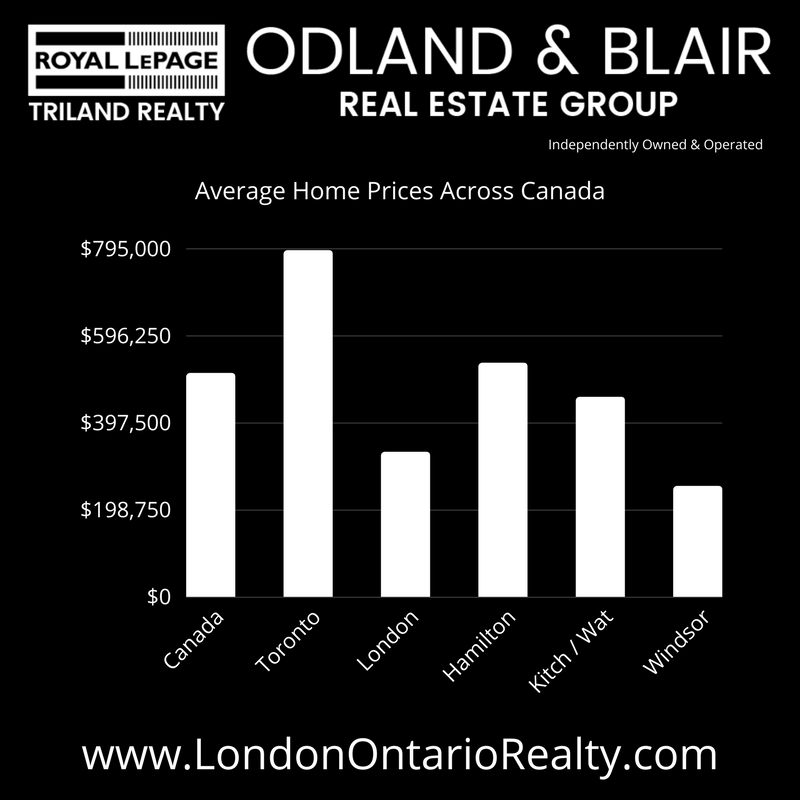
The above chart is based on the data taken from the CREA National MLS® Report for October 2017
*The London and St Thomas Real Estate Board break London down into three distinct areas North, South, and East.