

London Real Estate Market Update – Jan 2020
Here is your Real Estate Market Update January 2020.
The London & St Thomas association of Realtors (LSTAR) started the year, and decade, at an almost record setting pace. The London & St Thomas areas achieved their 2nd best January since 1978 (When LSTAR started tracking its markets’ performance).
Market Highlights
568 homes exchanged hands last month
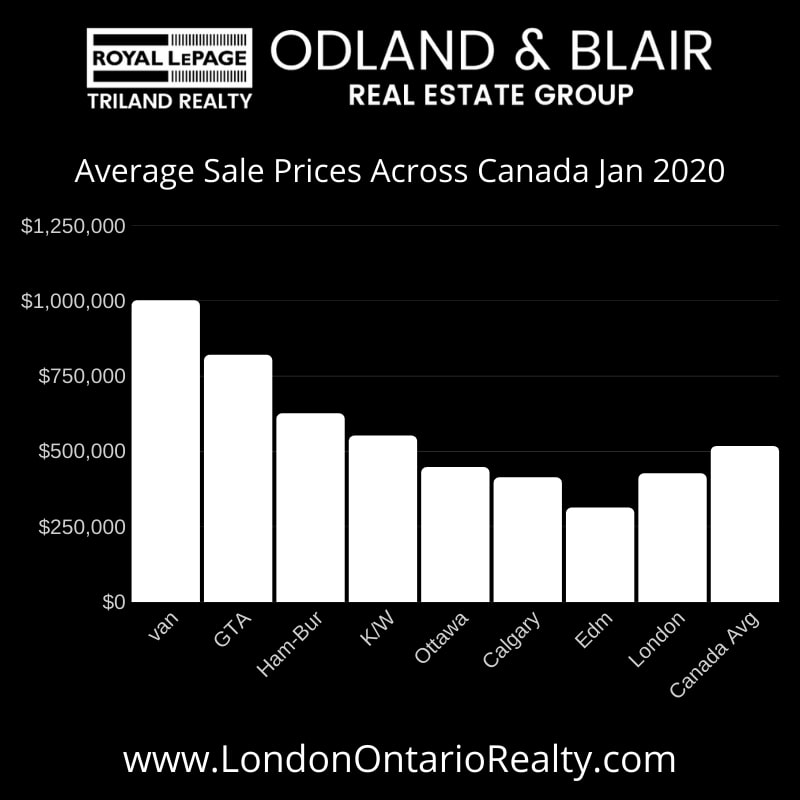
Average home price for the region was 437,197, 13.9% higher than a year ago and 48.2% over January 2017
Compared to January 2010, the percentage of price growth is a whopping 95.2%
LSTAR President offered the following comments “Despite the high number of home sales and the increasing house prices, the number of new listings that hit the local market in January 2020 saw a 9.4% increase over last year, which brought last month’s sales-to-new-listings ratio to 60.5%. This increase in listings for the month is fantastic as the lack of inventory has been a significant concern over the past two years,”.
Inventory is another important measure of the balance between sales and the supply of listings. This shows how long it would take to liquidate existing inventories at the current rate of sales activity. At the end of January 2020, there were 2.2 months of inventory across the entire LSTAR district – the lowest level in the last ten years.
The following table illustrates last month’s average home prices in LSTAR’s main regions and how they compare to the values recorded at the end of January 2019.
| Area | January 2020 Average Sale Price | Change over January 2019 |
|---|---|---|
| Elgin County | $410,314 | ↑25.6% |
| London | $452,924 | ↑16.8% |
| Middlesex County | $482,669 | ↓ 2.3% |
| St. Thomas | $384,291 | ↑12.0% |
| Strathroy | $452,960 | ↑13.8% |
| LSTAR | $437,197 | ↑ 13.9% |
Breakdown By Area
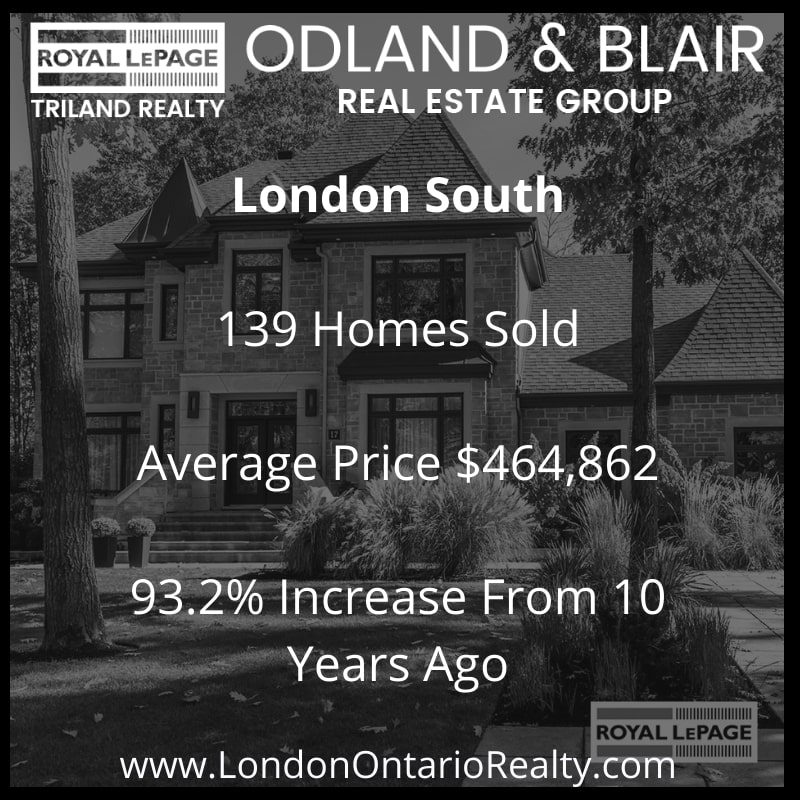
London South
139 Homes Sold
Average Price $464,862
93.2% Increase From 10 Years Ago
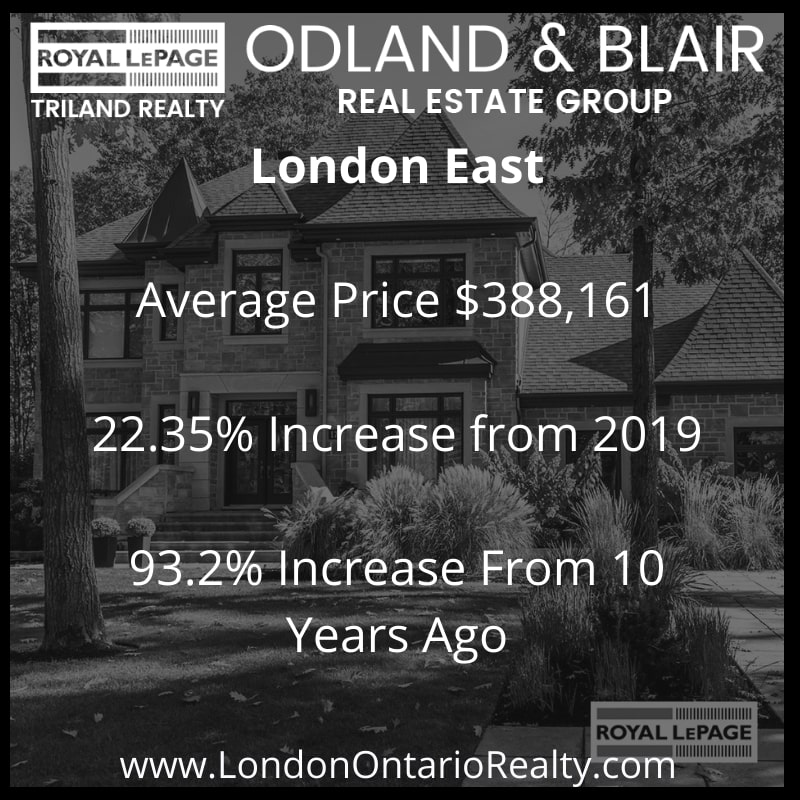
London East
Average Price $388,161
22.35% Increase from 2019
93.2% Increase From 10 Years Ago
London North
Average Price $503,576
5.4% Increase From 2019
Average Home Prices Across Canada
Did You Know?
According to a research report a total of $67,425 in ancillary expenditures is generated by the average housing transaction in Ontario over a period of three years from the date of purchase.
This means that our January home sales would translate into more than $38 million back into the local economy for the period 2020 – 2022
Market Info-graphics


How Can We Help?
Call Direct: 519.933.6198
If you are thinking of selling your home soon we would be happy to give you a FREE online home evaluation!
Click Here: FREE HOME EVALUATIONS
Want to learn more about The Odland & Blair Real Estate Group with Royal LePage Triland Realty?
Click Here: ABOUT US
Looking for more information on the London market? You can visit the London & St Thomas Association of Realtors site.
Click Here: MARKET UPDATES